
Contents
- 1 Introduction
- 2 Log in to Iptor WM1 Web Portal
- 3 Iptor WM1 Web Portal working environment
- 3.1 Home page
- 3.2 Dashboard module pages
- 3.3 Menu bar
- 3.3.1 Example
- 3.3.2 Components
- 3.3.3 Configure the default map chart types that appear for a module
- 3.3.4 Configure the default fields that appear in the grid view for a module
- 3.3.5 Customize the default number of results that appear in the grid view
- 3.3.6 View alert notifications
- 3.3.7 Dismiss alert notifications
- 3.3.8 Filter data by warehouse
- 3.3.9 Filter data by owner
- 3.3.10 Log out of Iptor WM1 Web Portal
- 3.4 Grid views
- 4
Introduction
The Iptor WM1 Web Portal provides real-time analytics and dashboards that operators and supervisors access from a web browser to manage their daily activities. The preconfigured dashboards provide a variety of statistical and operational data for your facility.
Use this guide to learn about the Iptor WM1 Web Portal working environment and how to use it.
Log in to Iptor WM1 Web Portal
- Log on to the device from which you want to access Iptor WM1 Web Portal.
- Start a web browser.
- In the address field, type http://<SERVER NAME>/dynaman/login.html, and then press Enter.
- On the login page, take the following actions.
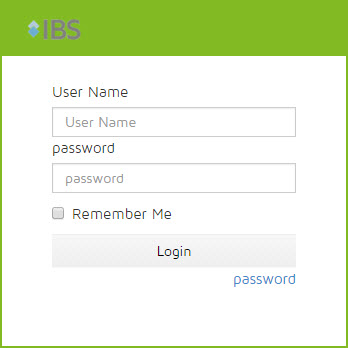
- In the User Name box, enter your user name.
- In the Password box, enter your password.
- Click Login. The Iptor WM1 Web Portal dashboard opens.

Iptor WM1 Web Portal working environment
The Iptor WM1 Web Portal pages provide navigational and functional components that let you view and customize the dashboards.
Home page
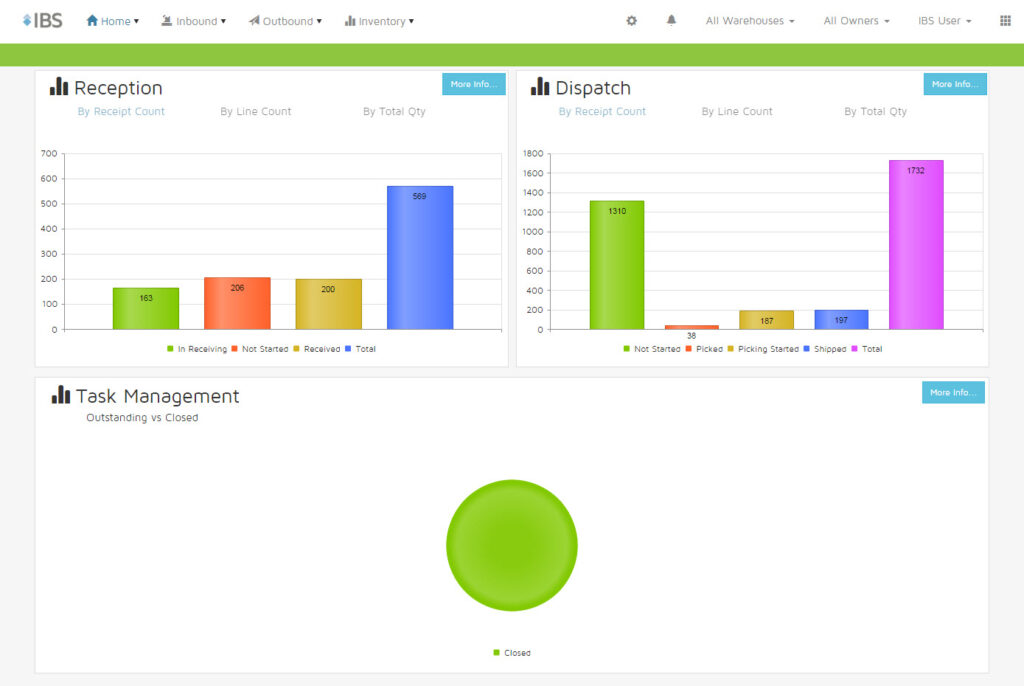
The home page is the initial page that appears when you first log on to the Iptor WM1 Web Portal.
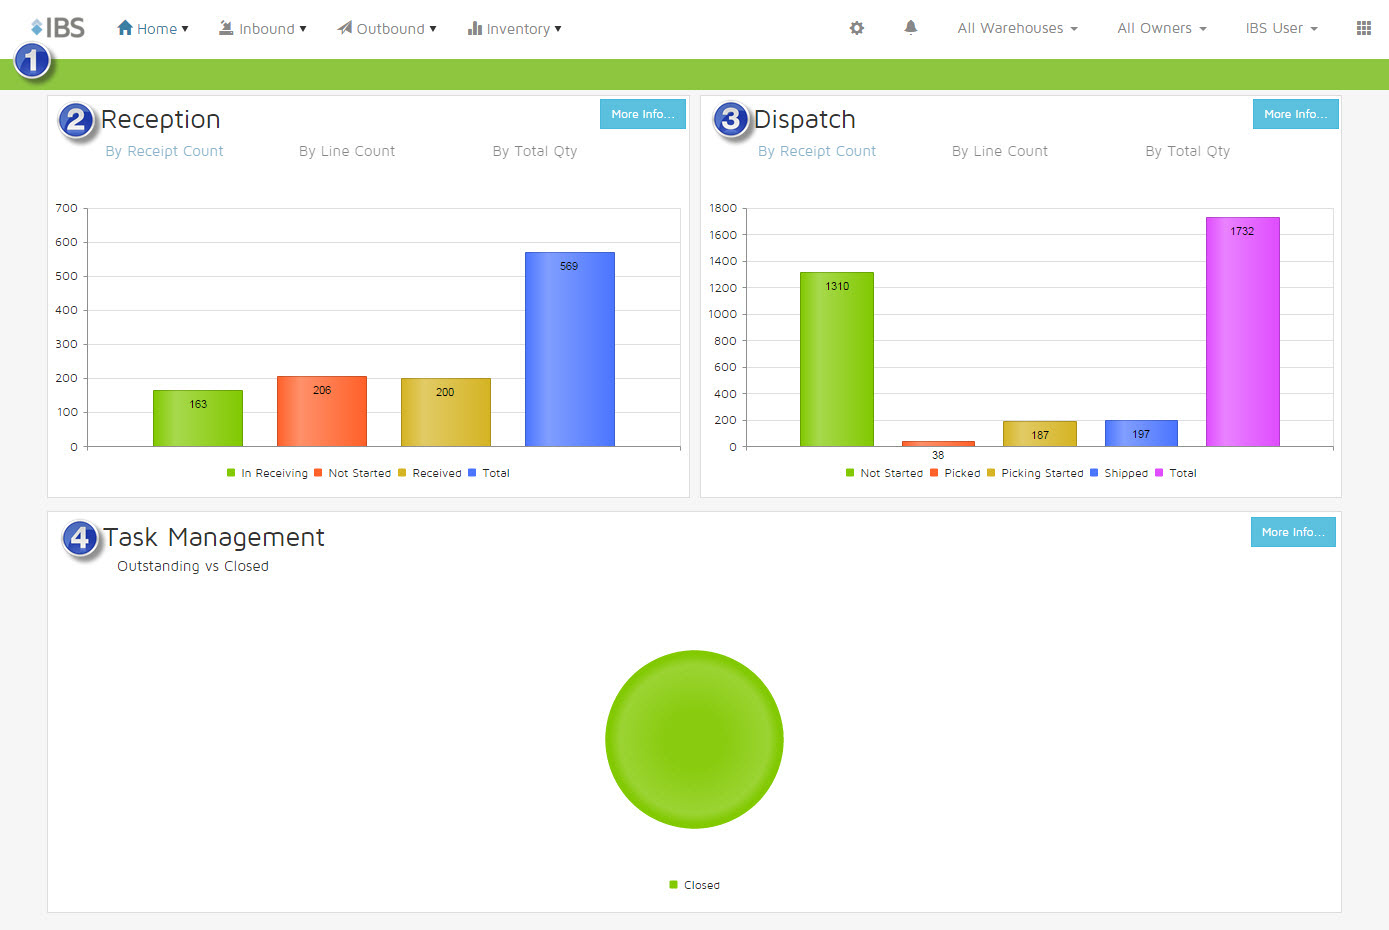
Example
The following image is an example of the home page with the essential components numbered.
![]()
![]()
![]()
![]()
Components
The following table identifies the components of the home page.
| Key | Component | Description |
| Menu bar | Appears at the top of every web portal page. For a detailed explanation see Menu bar. | |
| Reception chart | Provides the inbound order status in a column chart. By default, the data is presented By Receipt Count. To change views, click By Line Count or By Total Qty. | |
| Dispatch chart | Provides the outbound order status in a column chart. By default, the data is presented By Receipt Count. To change views, click By Line Count or By Total Qty. | |
| Task management chart | Provides the number of tasks that are open and closed in a pie chart. |
Dashboard module pages
The Iptor WM1 Web Portal provides a set of preconfigured dashboard modules with access to a variety of statistical and operational data for your facility. While each dashboard module page provides different data, the navigation and available functionality are the same.
Example
The following image is an example of a dashboard module page with the essential components labeled.

Components
The following table identifies the components of a dashboard module page.
| Key | Component | Description |
| Menu bar | Appears at the top of every web portal page. For a detailed explanation see Menu bar. | |
| Quick filter charts | Graphical view of the real-time information, broken down into the most commonly used segments. Can also be used to filter results. | |
| Hide/show button | Collapses and expands the quick filter chart. | |
| Configure chart type button | Opens the chart type selection page that lets you choose the quick filter chart you want to view. | |
| Search bar | Enter criteria to search for in the database. | |
| Grid view | Information can be sorted, manipulated or exported in common formats. |
Filter data using the quick filter chart
Three quick filter charts appear at the top of each dashboard module page (see Dashboard modules for more details). These interactive charts can be used to limit the data that appears in the charts and the grid view.
- On a dashboard module, in a quick filter chart, click the chart component for which you want to limit the data. For example, if you are on the Inbound Orders dashboard and you only want to view the orders that have been started, then in the Inbound Order By Status quick filter chart, click Started. The quick filter chart and grid view update to only show the data for the started orders.
Search for specific data
- In the Search box, begin typing the name of the field in which you want to search for data. As you type, a list of matching fields appears. Select the applicable field from the list.
- In the Search box, following the field name and colon, type the specific criteria for which you are searching, and then click
 . The quick filter charts and grid view update with the criteria that matches the text that you entered.
Save search criteria
- Click the Search Save menu (
 ), and then click Save Current Search.
 - On the Add Search Name dialog box, in the Search Name box, type the name you want to use to identify this search criteria, and then click Save. The saved search now appears in the Search box drop-down list for future selection.
Menu bar
The menu bar appears at the top of every page.
Example
The following image is an example of the menu bar with callout numbers on the essential components.
![]()
Components
The following table identifies the components of the home page.
| Key | Component | Description |
| Dashboard module menus | Access the home page and dashboard modules. | |
| Configuration button | Opens the configuration page that allows you to configure the dashboard module content. | |
| Alert menu | Lets you access the Alert Notifications page | |
| Filter menus | Lets you filter the data that is displayed by warehouse and owner. | |
| Logout menu | Access the option to log out of Iptor WM1 Web Portal. | |
| Default page settings menu | Allows you to save the current page as the default page that is to appear after logging in to Iptor WM1 Web Portal. |
Configure the default map chart types that appear for a module
- On the menu bar, click the Configuration button (
 ).
). - On the Configuration page, expand the Map Chart Type.
- In the Select Module list, click the module for which you want to update the map chart type.
- In the table, select the check boxes for the chart types that you want to view for this module, and clear the check boxes for any that you want to remove.
| Note | You can only have a total of three chart types selected. |
- Click Save Mapping.
Configure the default fields that appear in the grid view for a module
- On the menu bar, click the Configuration button ().
- On the Configuration page, expand Configure Order Key Fields.
- In the Select Module list, click the module for which you want to update the key fields
- In the table, select the check boxes for the fields that you want to view for this module, and clear the check boxes for any that you want to remove.
| Note | The check boxes cannot be cleared for the default required fields. |
- Click Save Mapping.
Customize the default number of results that appear in the grid view
- On the menu bar, click the Configuration button ().
- On the Configuration page, expand User Configuration.
- In the Grid Page Size list, click the number of results you want to view by default when results appear in grid view.
- Click Save Mapping.
View alert notifications
- On the menu bar, click the Alerts menu (
 ), and then click Show All Notifications.
 - On the Alert Notifications page, view the alerts information.
Dismiss alert notifications
- On the menu bar, click the Alerts menu (), and then click Show All Notifications.
- On the Alert Notifications page, click Dismiss All.
Filter data by warehouse
- On the menu bar, click All Warehouses, and then click the desired warehouse.
Filter data by owner
- On the menu bar, click All Owners, and then click the desired owner.
Log out of Iptor WM1 Web Portal
- On the menu bar, click Iptor User, and then click Logout.
Grid views
The grid view contains the data driving the reports. You can query this data, and you can manage the view of that data to see only the relevant fields for making business decisions. You can also create multiple views for the same page and quickly switch between the available views. Each of the results grids can be customized for both content and display sequence, and each user can save multiple views by naming the configuration. Additionally, the data can be exported for data manipulation and reporting as needed.
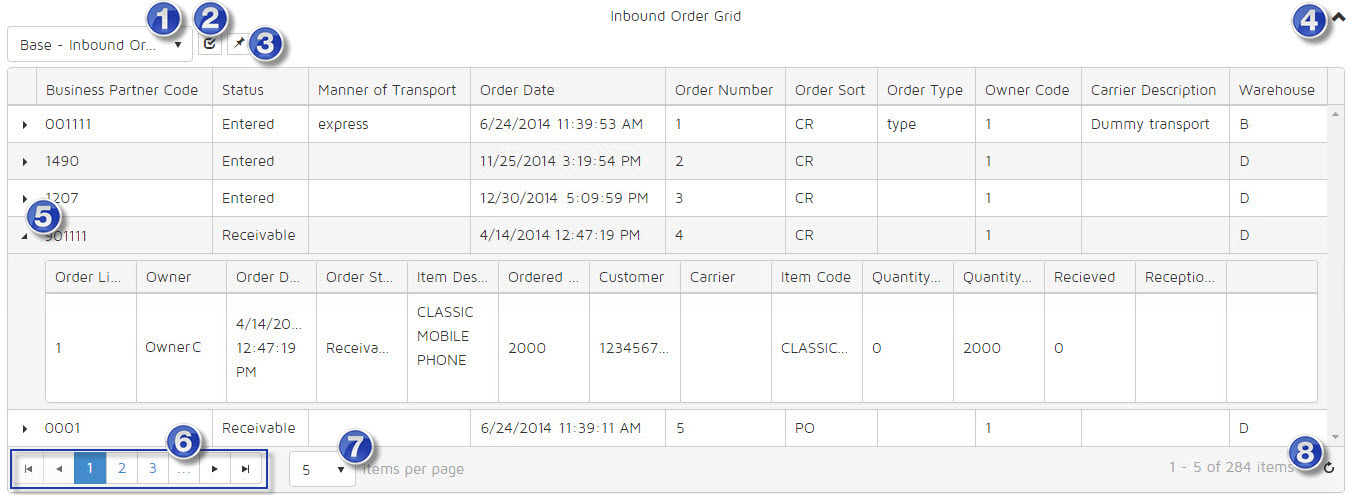
Example
The following image is an example of a grid view.
Components
The following table identifies the components of a grid view.
| Key | Component | Description |
| View Selection menu | Lets you select a different view profile for the grid view data. The view profile determines the columns that appear in the grid view. | |
| Apply View button | Applies the view profile that you selected in the View Selection menu. Once clicked, the grid view updates with the new columns. | |
| Manage View button | Lets you open the Manage Views dialog box to create and save new view profiles, and edit existing view profiles. You can also set the default view profile. | |
| Hide/show button | Hides and shows the grid view panel. | |
| Expand/collapse button | Expands and collapses a grid view row to expose or hide the order line details. | |
| Page navigation buttons | Click specific numbers, or use arrows to navigate to next pages. | |
| Rows Per Page menu | Select to change the number of rows displayed on a single page. | |
| Refresh button | Click to refresh the data in the grid view. |
Change views
- Click the View Selection menu, and then click the desired view.
- Click the Apply View button (
 ). The grid view updates to show the data in the new view.
View order line details
- In the grid view row for which you want to view details, click
 . The order line detail rows appear.
Hide order line details
- In the grid view row for which you want to hide details, click
 . The order line detail rows collapse under the grid view row.
Adjust the number of grid view results
- At the bottom of the grid view, click the Rows Per Page menu (
 ), and then click the selection that corresponds to the number of rows that you want to view.
Refresh the data
- Click the Refresh button (
 ). The page refreshes with the latest data.
