
Contents
Introduction
Cockpit charts are realtime, visual representations of current activities within your warehouse. With cockpit charts, you can continuously monitor activity so you can proactively respond to potential issues before they occur. Cockpit charts are configured to meet your unique requirements; therefore, you decide how many charts you need and what activities are the most important for you to monitor. When you configure a cockpit chart, you have many chart type options from which to choose. With these options, you can ensure that the charts you create present information in a format that is easy for you to interpret.
Example: Cockpit chart
The following image illustrates a cockpit chart that is configured to display the number of outstanding tasks in the warehouse per task type. This chart could be used to help you effectively allocate resources to complete specific tasks.

Purpose of this guide
This guide explains how to create charts that gather realtime data directly from your Iptor WM1 database, and present a graphical representation of the data for easier interpretation. In addition, this guide explains how to add the charts that you create to the menu under the Cockpit menu group.
Audience
This guide is written for system administrators who have the ability to access and manipulate the data in the Iptor WM1 database.
Prerequisites
To successfully create and design charts, you must have:
- An Iptor WM1 user login that lets you access the Chart and Boxes functionality.
- Purchased and installed Infragistics™ 14.2 Windows Forms Tools. The software must be installed on the Iptor WM1 client from which cockpit charts will be created and maintained.
| Note | Infragistics includes the Design Wizard, which is the tool that walks you through the chart design process. |
- Knowledge of the Iptor WM1 database structure.
- The ability to write the SQL statements required to pull the appropriate data from the database. This is the data that will be represented in the charts.
Create and design a chart
Procedure overview
You must complete the following four tasks, in the order specified, when creating a chart that you can view within the Iptor WM1 user interface.
- Create the chart
- Design the chart
- Add the new chart to the Cockpit group in the menu
- Verify that the chart appears in the menu.
Procedure
- Create the chart.
- On the menu, expand Basic Data > System > Charts & Boxes and then double-click Chart.
- On the Charts window, in the toolbar, click
 . The Add Chart window appears.
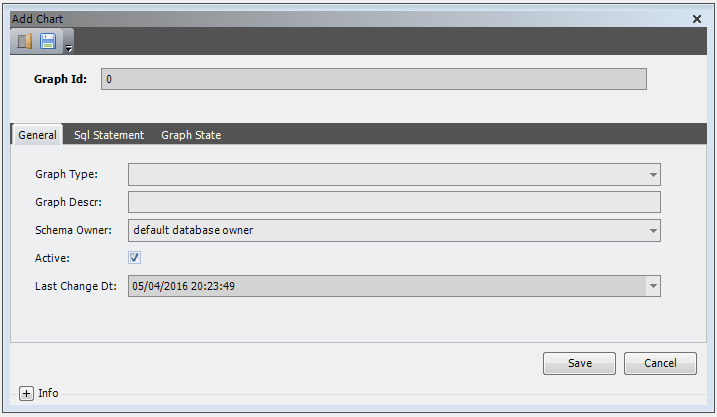
- Enter the following information.
Field Description Required Graph ID Unique system identifier for the chart. Iptor WM1 automatically assigns a Graph ID; however, you can modify the value. You will use this value later when you add the chart to the menu. Yes Graph Type Type of graph to create. Standard value is Chart, which will display a default chart type. You can specify your preferred chart type when you design the chart, later in this procedure. Yes Graph Description Brief statement that describes the purpose of the chart. For example, when creating a chart to display the number of existing tasks for each task type, use Tasks per Task Type. No Schema Owner Database user that is assigned ownership of the database tables associated with the chart. By including this value, you eliminate the need to indicate a specific database user/owner when calling data from a database table in your SQL statement.
Default value is ‘default database owner’
Yes Active Indicates that the chart is accessible for viewing. Yes – Either selected to make the chart accessible, or cleared to deactivate the chart. Last Change Date Date on which the chart was last changed. This is a system-generated value.
Defaults to current date and timestamp.
Yes - Click the SQL Statement tab, and then in the text box, enter the SQL statement to pull the data that will be used to generate the chart. For example, to generate a chart that displays the number of existing tasks per task type, enter this SQL statement: select task_type,count(*) as Cnt from task_detail group by task_type
- Click Save. The chart name appears in the grid view on the Chart window.
- Design the chart.
- On the Chart window, in the grid view, select the chart that you created and then in the toolbar, click
 . The Design Chart window appears and displays the default chart type.

- In the toolbar, click
 . The Chart Wizard window appears.

- Next to the type of chart that you want to create, click Select. The Chart Wizard appears, and the Chart Type page is active.
Note The instructions in this document explain how to design a chart using the Chart Wizard, not the Composite Chart Wizard. The wizard walks you through the entire process and provides instruction throughout. 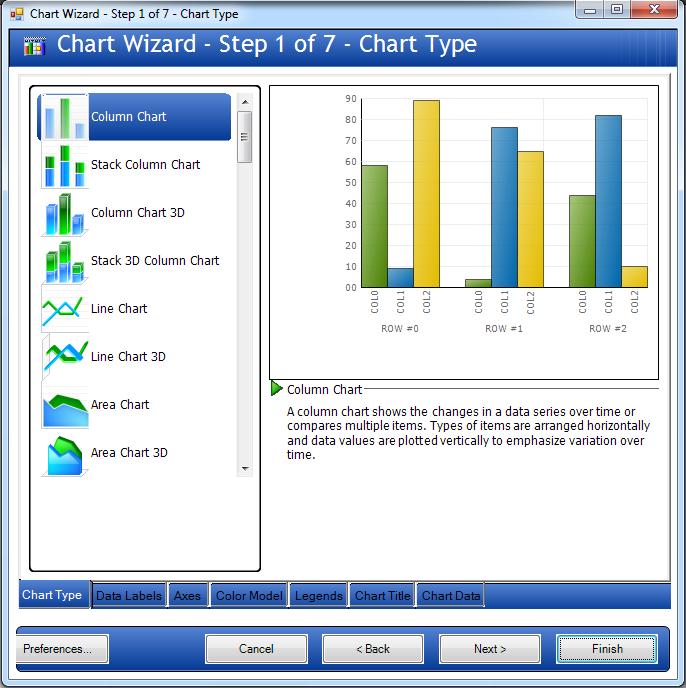
- In the list of chart types, select the type of chart that you want to create, and then click Next.
- On the Data Labels page, if you want data values to appear in the chart, select the Show data values on chart check box, and then click Next.
Note Some chart types do not support data values. If the chart type you selected does not support data values, then the check box is disabled. - On the Axes page, take the following actions.
- Select the axis for which you want to set properties.
- If desired, change the format string for the axis.
- Select the data label format.
- Select the grid line format.
- If the chart type has more than one axis, repeat this step until you have configured all axes.
- Click Next.
- On the Color Model page, select the color styles that you want to apply to the chart, and then click Next.
- On the Legends page, if you want to display a legend on the chart, take the following actions.
- select the Show Legend check box.
- Click a Placement option button to determine where you want the legend to appear.
- Click Next.
- On the Chart Title page, in the box that is associated with the location in which you want the title to appear, type the chart title, and then click Next.
Note You can use the formatting options above the box to format the title. - On the Chart Data page, click Finish. The chart that you designed appears in the Design Chart window.
Note You do not have to apply any data binding features. - If the chart meets your requirements, click
 to save the chart; otherwise, click to modify your selections in the Chart Wizard.
 - When you have saved the chart, close the Chart Designer.
- On the Chart window, in the grid view, select the chart that you created and then in the toolbar, click
- Add the new chart to the Cockpit group in the menu.
- On the menu, expand Basic Data > System > Menu and then double-click Menu Function.
- On the Menu Function window, in the toolbar, click . The Add Menu Function window appears.

- Enter the following information.
Note Only the required fields are described in the table below. You can use the default values in the remaining fields. Field Description Required Function Key Unique system identifier for the menu function.
For example: DISPLAY_TASKTYPE_CHART
Yes Function Name Identifier for the function. This can be any text that identifies the purpose of the menu option. Typically, this is the same as the graph description, which you added earlier in this procedure. Yes Function Description Brief statement that describes the purpose of the chart. Typically, this is the same as the graph description, which you added earlier in this procedure.
No Schema Owner Database user that is assigned ownership of the database tables associated with the chart. Be sure that the value in this field matches the Schema Owner value that you added in the Add Chart window. Yes - Click the Design tab, and then from the Graph ID list, select the graph ID for the chart that you want to display when the menu option is selected. This is the graph ID that was provided when the chart was created.
- Click Save.
- On the menu, expand Basic Data > System > Menu and then double-click Menu Item.
- On the Menu Item window, in the toolbar, click . The Add Menu Item window appears.

- Enter the following information.
Note Only the required fields are described in the table below. You can use the default values in the remaining fields. Field Description Required Menu Code Unique system identifier for the menu to which the chart will be added. For Cockpit charts, select SYS. Yes Menu Key Value that is meaningful to the chart you are adding to the menu. For example, TASKS_PER_TASKTYPE Yes Menu Text Brief statement that describes the purpose of the chart that you are adding to the menu. For example, Tasks per Tassk Type. This is the text that will appear in the menu. Yes Function Key Function key that you specified when you defined the menu function. Yes Parent Key Menu group under which the chart will appear. For Cockpit charts, select COCKPITCHARTS. Yes - Click Save.
- Verify that the chart appears in the menu.
- Log off of Iptor WM1, and then log back in.
- On the menu, expand Cockpit > Charts, and then verify that your chart appears in the list.
- Click the chart name to ensure that the chart appears.
- If the chart does not appear, review the procedure to ensure that you completed all of the steps accurately.
- To view up-to-date information in the chart, refresh your browser or close the chart and then reopen it.
Save and print the chart image
After the chart is created, and you can view it in Iptor WM1, you have options to save and print the chart image.
- Display the chart.
- Right-click anywhere on the chart.
- From the menu, take any one of the following actions.
If you want to…. Then click… Print the chart, Print. Your print dialog box appears, and you can set your preferences and then print. Preview the image before you print, Print Preview. The chart appears in the Print Preview window where you can zoom in and out of the image, change the page layout and print the image. Save the image with a transparent background, Save to Image (with transparent background). Save the image, Save to Image.
